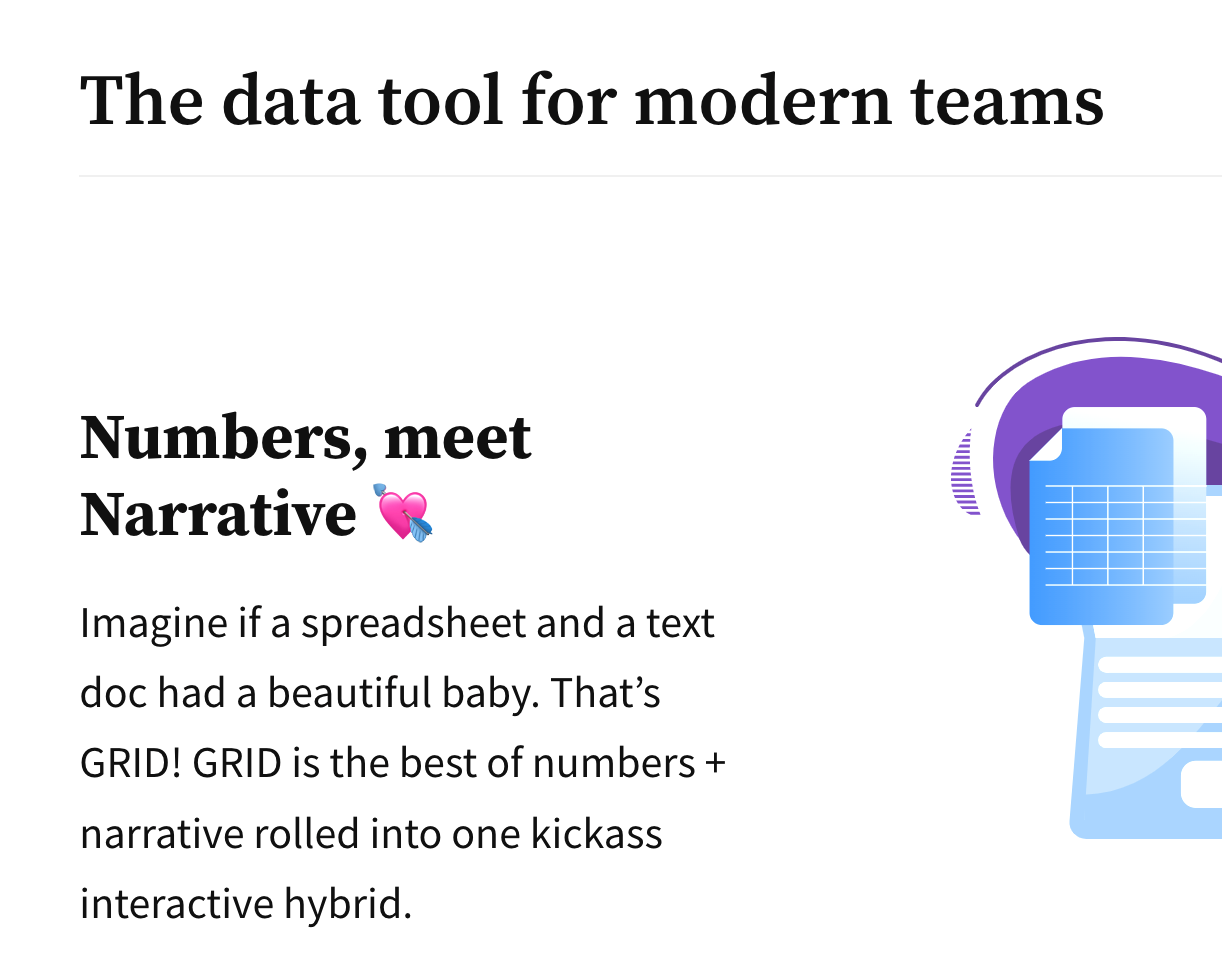
GRID Blog: Smart Chart feature launch
Introducing GRID Smart Charts for databases
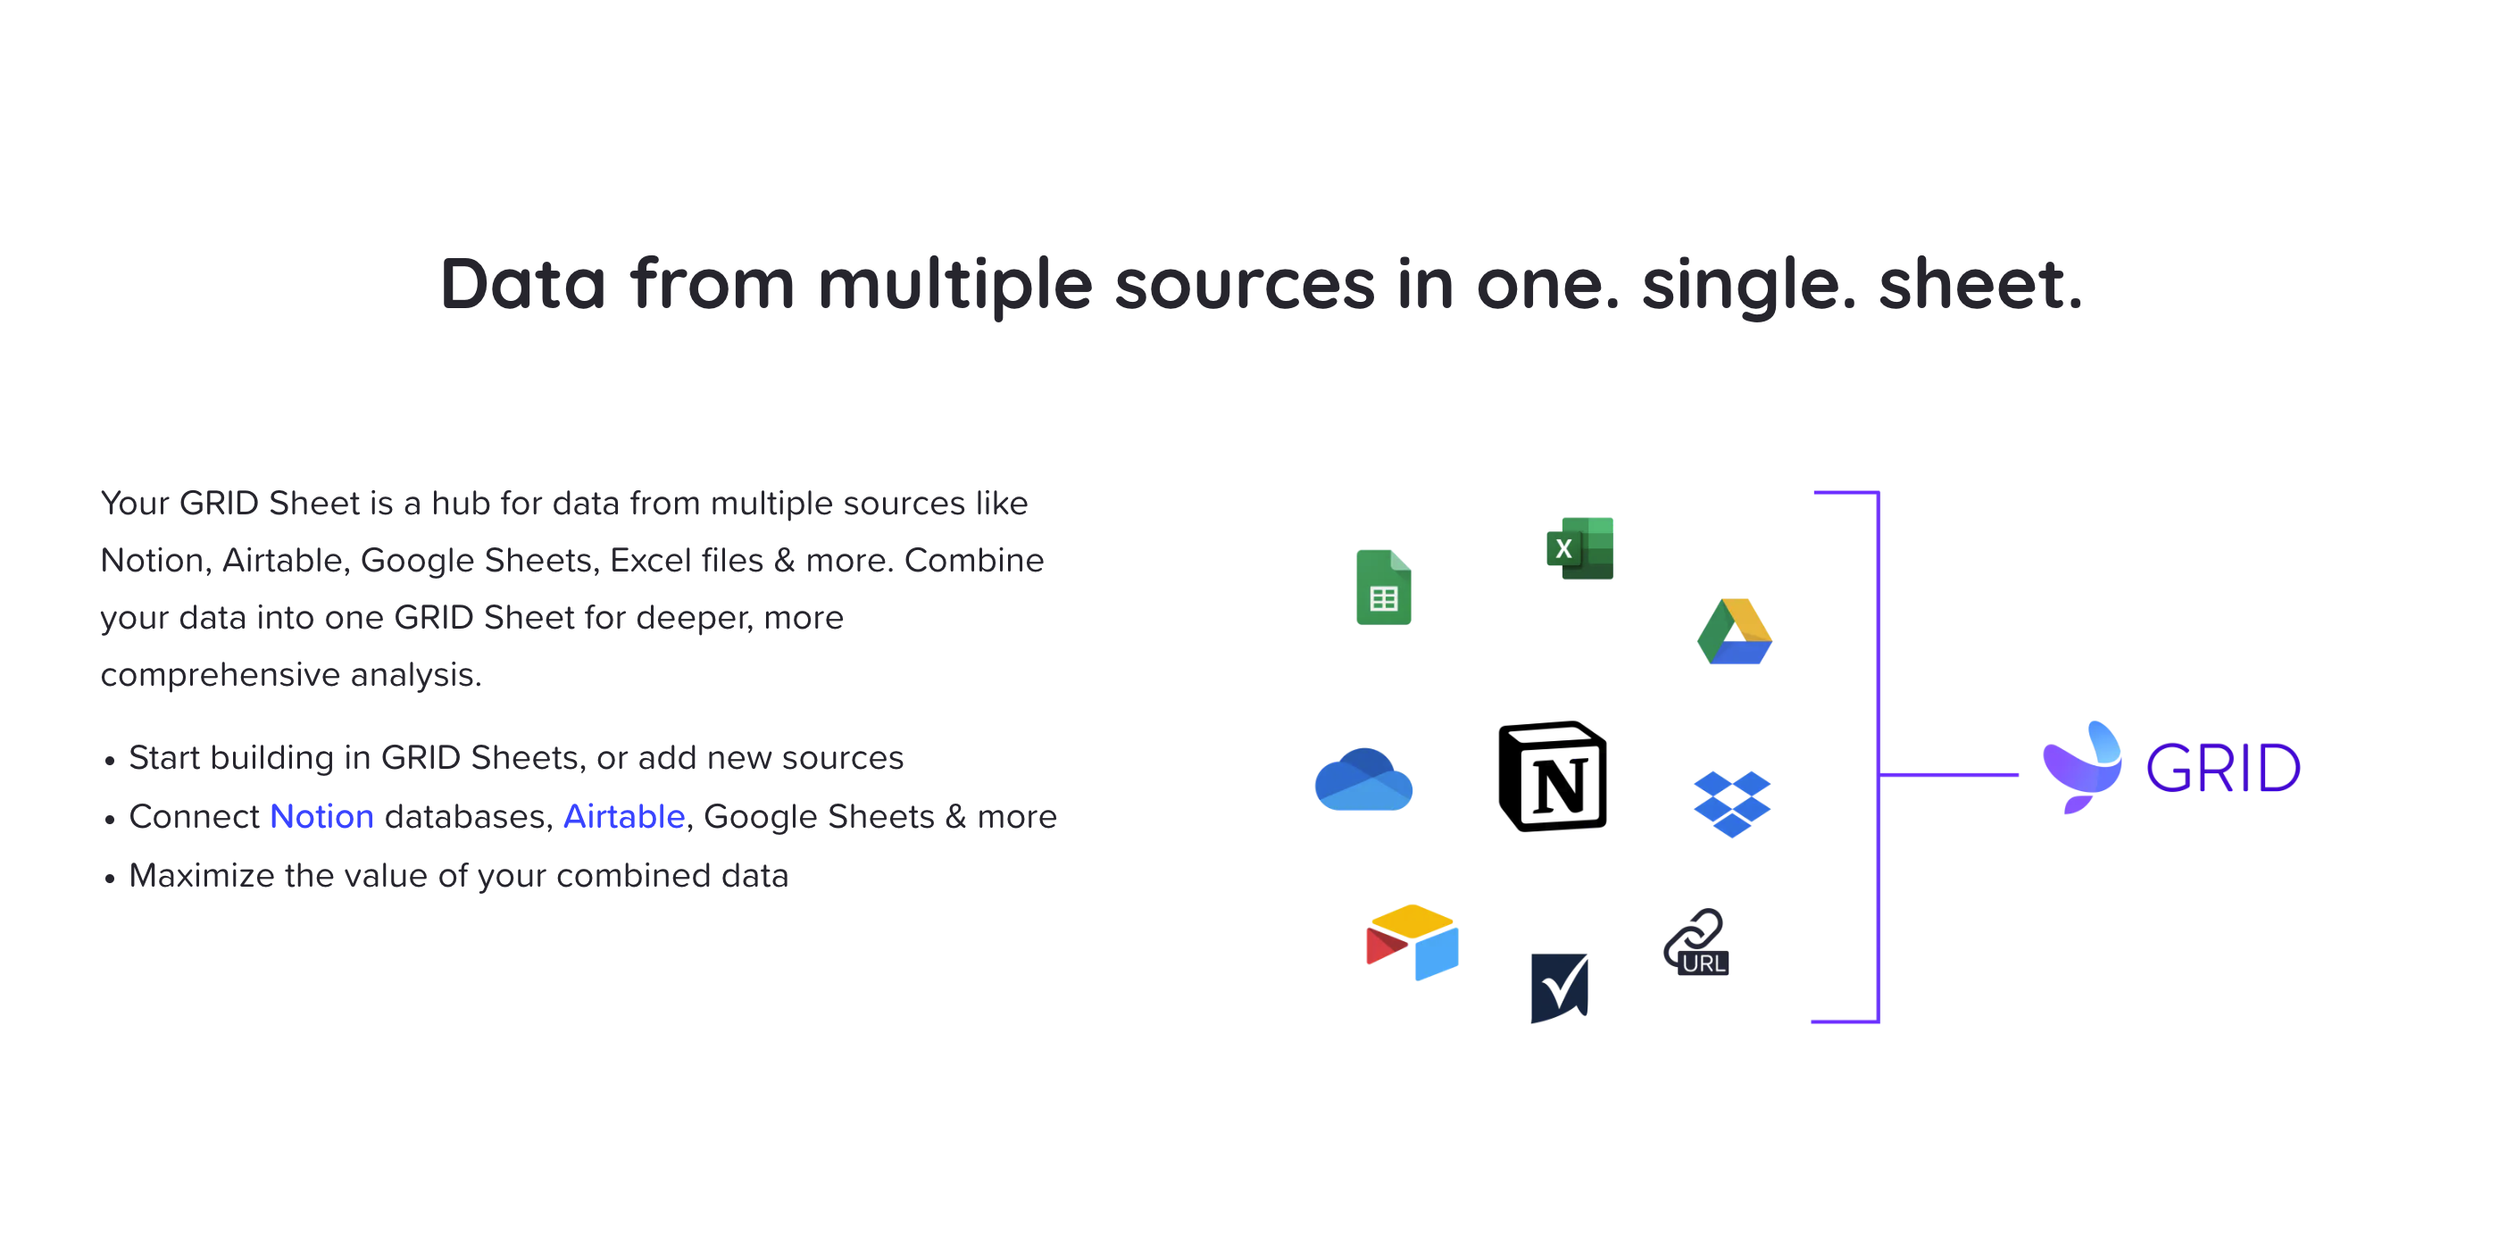
Lately, the team has been busy exploring ways to better facilitate chart-building with tabular data. That’s data in a structured table, like Notion databases and Airtable bases. To address the need for an easier, more cohesive approach, we’ve developed a powerful set of tools that we’re thrilled to be launching on Product Hunt.
GRID Smart Charts for databases encapsulates a suite of three features: Chart Builder, AI Chart Assistant & Structured Sheets. These features are designed to simplify the process of summarizing, aggregating & visualizing tabular data, helping you transform your databases into meaningful charts and tables.
Chart Builder: the power of pivot tables, without the hassle
One of the common hurdles when working with structured tables is that it isn’t always obvious how the data should be visualized. Sometimes, creating a chart directly from such data doesn’t produce an understandable result. And to summarize it, you’d typically need to write a complex QUERY function
This is where Chart Builder comes in. A game-changer for anyone who finds pivot tables a little daunting, the Chart Builder has a simple point-and-click interface offering an easy way to filter, split, and aggregate data.
Chart Builder lets you easily summarize data in a way that makes sense to you, and options like Filter by and Split by further enhance the flexibility and depth of your analysis. As you adjust the settings and explore the data, you’ll discover in real time which insights you need to visualize. You’ll get incredible value from your Notion and Airtable data as you better leverage it in the impactful charts and no-code pivot tables you create.
If you’re wondering how to get started, simply connect your Notion database or Airtable base to a GRID document, and you'll be offered the option to use the Chart Builder. Choose your desired chart type and customize the options.
Watch our quick Chart Builder tutorial for more detail on how to better communicate the richness of your data.
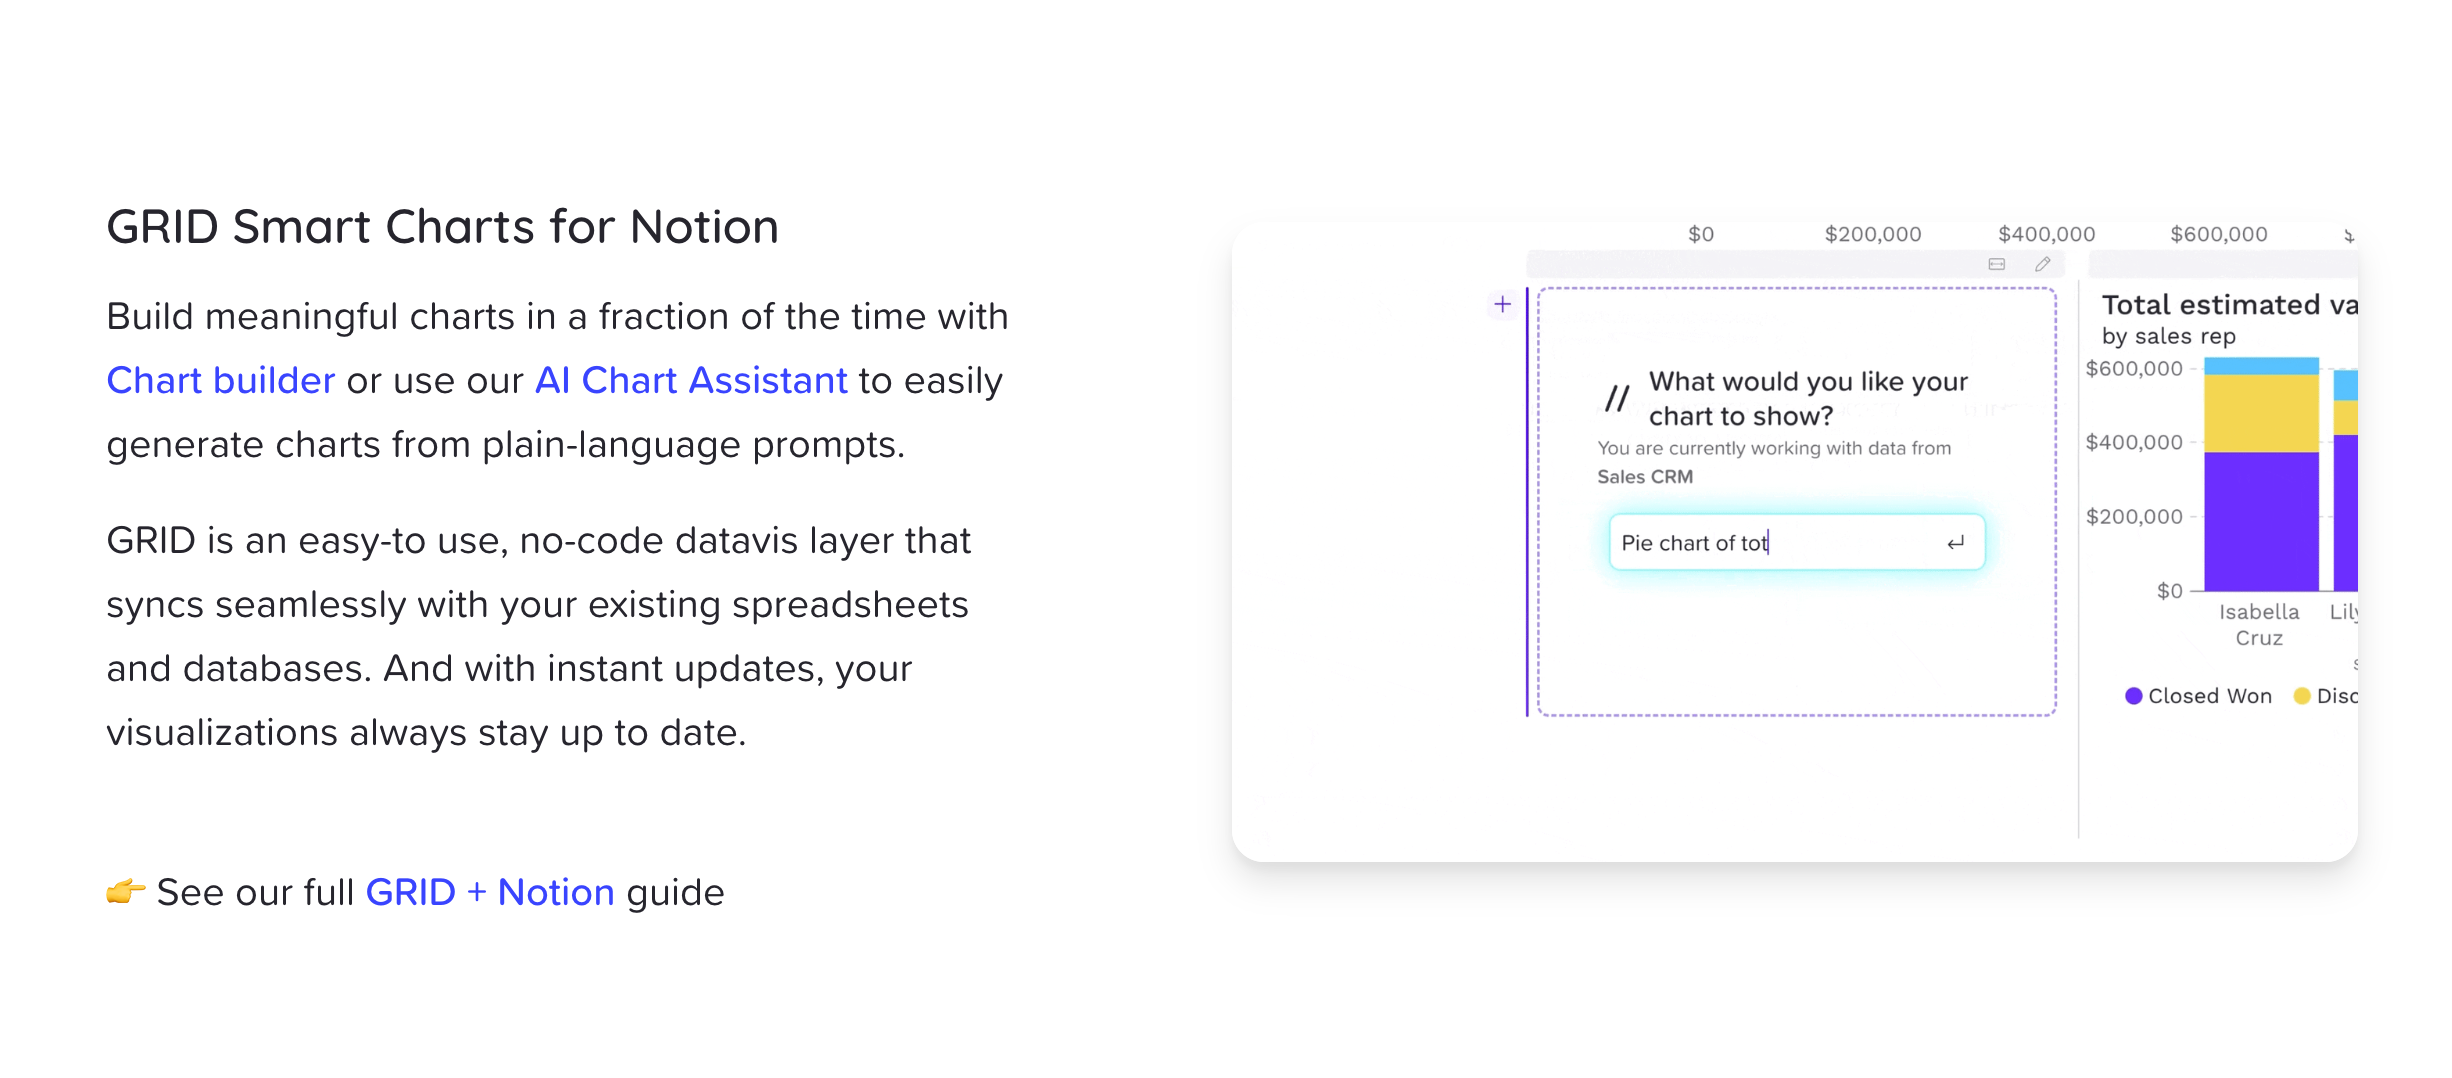
AI Chart Assistant: instantly generate charts with a simple prompt
We first introduced our AI Formula Assistant a few months ago, and now we’re furthering our exploration of AI features in GRID with our AI Chart Assistant. Currently, the Chart Assistant builds charts from Notion and Airtable data, but stay tuned for expanded capabilities in the future!
Our AI Chart Assistant makes for a super streamlined chart-building experience. As an intelligent feature, it leverages natural language processing to generate charts based on your plain-language prompts. Simply describe the chart you need, and the assistant will create it for you.
Here’s how it works. Connect a Notion database/Airtable base and look for the Build a chart button in the lower right corner of the data panel. From there, you can further customize the chart to meet your specific requirements.
Structured Sheets: enhanced querying and aggregation for tabular data
Structured Sheets offer stronger querying and aggregation capabilities for rich, tabular data from Notion and Airtable. These sheets provide a different interface and a tailored set of functionalities when working with and quantifying structured data in GRID.
Structured sources are now displayed in GRID in a clear, column structure with headers that simplify referencing column names in the data panel. Structured Sheets make it easy to:
● Perform advanced aggregations
● Seamlessly combine with data in other connected free-form spreadsheets
● Leverage historical data from a structured sheet to inform a free-form spreadsheet model
For more background on structured sheets and our other Smart Chart features, read our CEO’s latest blog.
Pivot tables for the people
At GRID, we strive to empower people and their teams to do great data work. With the introduction of GRID Smart Charts for databases, we've brought together a powerful combination of smart datavis tools that make working with and communicating tabular data faster and more accessible than ever before. Whether you're a data analyst or a business professional, GRID provides the tools you need to unlock the true potential of your data.
Sign up for free at grid.is to experience a new level of productivity and insight.
GRID Tutorial:
How to use Layout - script and voiceover
Customer story: Jordan Shapiro, IonQ Quantum Computing
How IonQ uses GRID to support strategic decision-making
IonQ is ready to tackle the world’s most complex problems. Founded by Dr. Chris Monroe and Dr. Jungsang Kim in 2015, IonQ is at the forefront of quantum computing, firmly committed to developing a revolutionary technology that has the potential to change the world. We spoke with Jordan Shapiro, IonQ’s Vice President of Financial Planning & Analysis and Head of Investor Relations, to find out why he thinks GRID is the perfect tool for collaborative analysis.
*Before joining IonQ, Jordan Shapiro was an investor at NEA. He was a part of the investment team that led GRID’s Series A funding round.
Prompting action-oriented conversations
Jordan describes GRID as a “key drawing board” for IonQ’s management team. He initially introduced GRID to IonQ two years ago as a tool to assist in navigating major decision-making processes related to taking the company public.
A core function of FP&A is to report out to the rest of the organization so that we can make strategic decisions informed by our financial data.
After constructing and sharing a complex financial model with his team, Jordan noted that the tactile nature of the GRID model was highly beneficial in leadership meetings. Since GRID makes it easy for viewers to switch back to the original scenario at any time, executives could reorient their thinking based on the preliminary model and still feel confident about manipulating variables on their own.
Through interactive exploration, IonQ’s executive team was able to arrive at a deeper collective understanding of the different scenarios at play in the model, along with the implications of each. This alignment also had a positive impact on the efficacy of team meetings, where communication became distinctly more collaborative and action-oriented.
GRID was a key tool for allowing us to decide what to do and it allowed our leadership meetings to be less informative, and more collaborative. We were able to quickly build intuition around our financial models, which saved us time to focus on more strategic topics, like fundraising.
The financial model created for this case was, in fact, the end-product of multiple GRID documents created over the course of more than a month. GRID’s flexibility as a tool facilitated the iterative process required to update scenarios and account for changing needs over time. The resulting model “accomplished the goal of giving the executive team everything we needed at once,” Jordan explains, and the dwindling number of requests for further analysis was a key sign indicating to him how well the model was serving its purpose.
Supporting strategic decisions
Another important use case for GRID at IonQ centers on supporting candidates and new employees in understanding their offer packages.
IonQ’s recruiting team uses a GRID-built equity calculator to present and explain specific compensation scenarios to incoming candidates. The tool addresses a commonly voiced need for further explanation as candidates attempt to fully understand the package’s extensive offerings. “Often, offers can appear complicated since they may include base salary, potential bonuses, and equity packages” Jordan explains.
With the offer calculator, IonQ’s recruiting team can guide new employees through the variables interactively, change sliders and input fields to create show scenarios, and empower candidates with knowledge that had previously seemed inaccessible. This strengthens the candidates’ position during negotiations and clarifies the exact value of the assets IonQ offers. Jordan notes that “you really want to communicate this to your candidates so that they appreciate the full value of what you're giving them.”
At the same time, the calculator saves recruiters at IonQ significant time and energy, making it easy for them to create customized scenarios for each individual candidate.
…we used to take a lot of calls to explain equity packages – and in part because we've delivered this calculator to the recruiting team, and in part because we've provided it to candidates, we don't see as many of those calls happening. So that's a big benefit to our team’s time.
GRID has played an important role in helping to explain equity to new employees at IonQ. As a result, they’re joining the company with greater confidence in the compensation they can expect to earn.
Keeping high-achieving teams informed
A third case where GRID helps teams at IonQ better align behind the numbers comes in the form of an interactive pricing calculator. In order to accommodate the highly specific needs that arise in an emerging field like quantum computing, the sales team at IonQ needed a solution with the flexibility to make occasional updates to their pricing structure.
The sales calculator that the team is currently building with GRID works to simplify the communication of a complex pricing model and keeps the team apprised of important developments. Perhaps most importantly, the completed calculator will act as a powerful tool to help the sales team explain potential deals and relate costs to individual customers in the terms that are most relevant to them.
Customers vary in how they want to talk about the quantum compute capacity they are buying – we wanted to make it as easy as possible for our sales team to go sell.
Discussing the building process, Jordan outlines that “the pricing model started as a large model in Excel, and then we built a GRID calculator layer on top of it to make it really easy for the sales team to articulate to the customers what they're getting.” By illuminating a complex and evolving set of variables with GRID calculators, IonQ’s sales team is staying at the forefront of this exciting field.
Anticipating multiple futures
With a steadily increasing number of his team members building with GRID, Jordan anticipates that IonQ will have several GRID projects to develop in the near future. Asked if he sees other use cases for GRID at IonQ, his response is immediately affirmative: “Definitely.”
We provide monthly reports to our CFO and CEO and that's a great opportunity for GRID as well. Today, the report comes in the form of a Google doc that collates multiple spreadsheets from our accounting and FP&A teams – combining them via a GRID document would make it easier to adjust every month.
GRID’s strength as a reporting tool is particularly relevant for CFOs, people working in financial planning and analysis, and potentially in any department where there is a need to visualize spreadsheet data, add narrative, and share it with other teams across the organization.
Jordan takes particular note of how effective GRID can be in reducing the chances of human error in reporting at IonQ, saving team members time and effort, and tying numbers and narrative together in a way that’s helpful for people. “Currently,” he explains, “our reporting documents require a lot of manual effort to tie together numbers from Excel and narrative from Word – that could be much better done in GRID.”
So where does GRID really set itself apart? According to Jordan, GRID particularly shines in cases where complicated decisions need to be made, and where all of the variables are known – but due to the multitude of those variables, it’s necessary to discern which are most important, and by extension, which scenarios matter the most.
Another area of excellence? With a defined model to be shared and discussed, GRID is an ideal means for spreadsheet experts (members of finance teams for example) to present such models to non-experts in other departments in a friendly, accessible way.
The best option for sharing with non-experts is not to have a spreadsheet where they might accidentally break it or they have to open it in Excel in order to use it – the best way to do it is to populate it into a web browser via GRID and send it to them as a calculator or a model wrapped with narrative.
As a final comment on how his team feels about working with GRID, Jordan shares that many on the team have been pleasantly surprised. “The reactions we get from the team are excitement and amazement when they see the tool – and relief” he reveals. “That's the type of reaction you're only going to get with a GRID document and you’re not always going to get with a static Excel or PowerPoint. That dynamic use of the numbers is something that everyone benefits from and it's only getting better and better.”
*This article was originally published in 2023
Landing pages: Product launches, integrations & new features
-

Alrún Nordic Design
Project: Katrin Bernd x Alrún Nordic Design: a collaboration. This brand awareness campaign introduced Alrún to a new audience of young Scandinavians interested in Nordic mysticism.
-

CCP Games
Project: Promotional blogs, event schedules, and daily coverage of speakers and special guests at Fanfest 2025 held at Harpa Concert Hall in Reykjavík, Iceland.
-
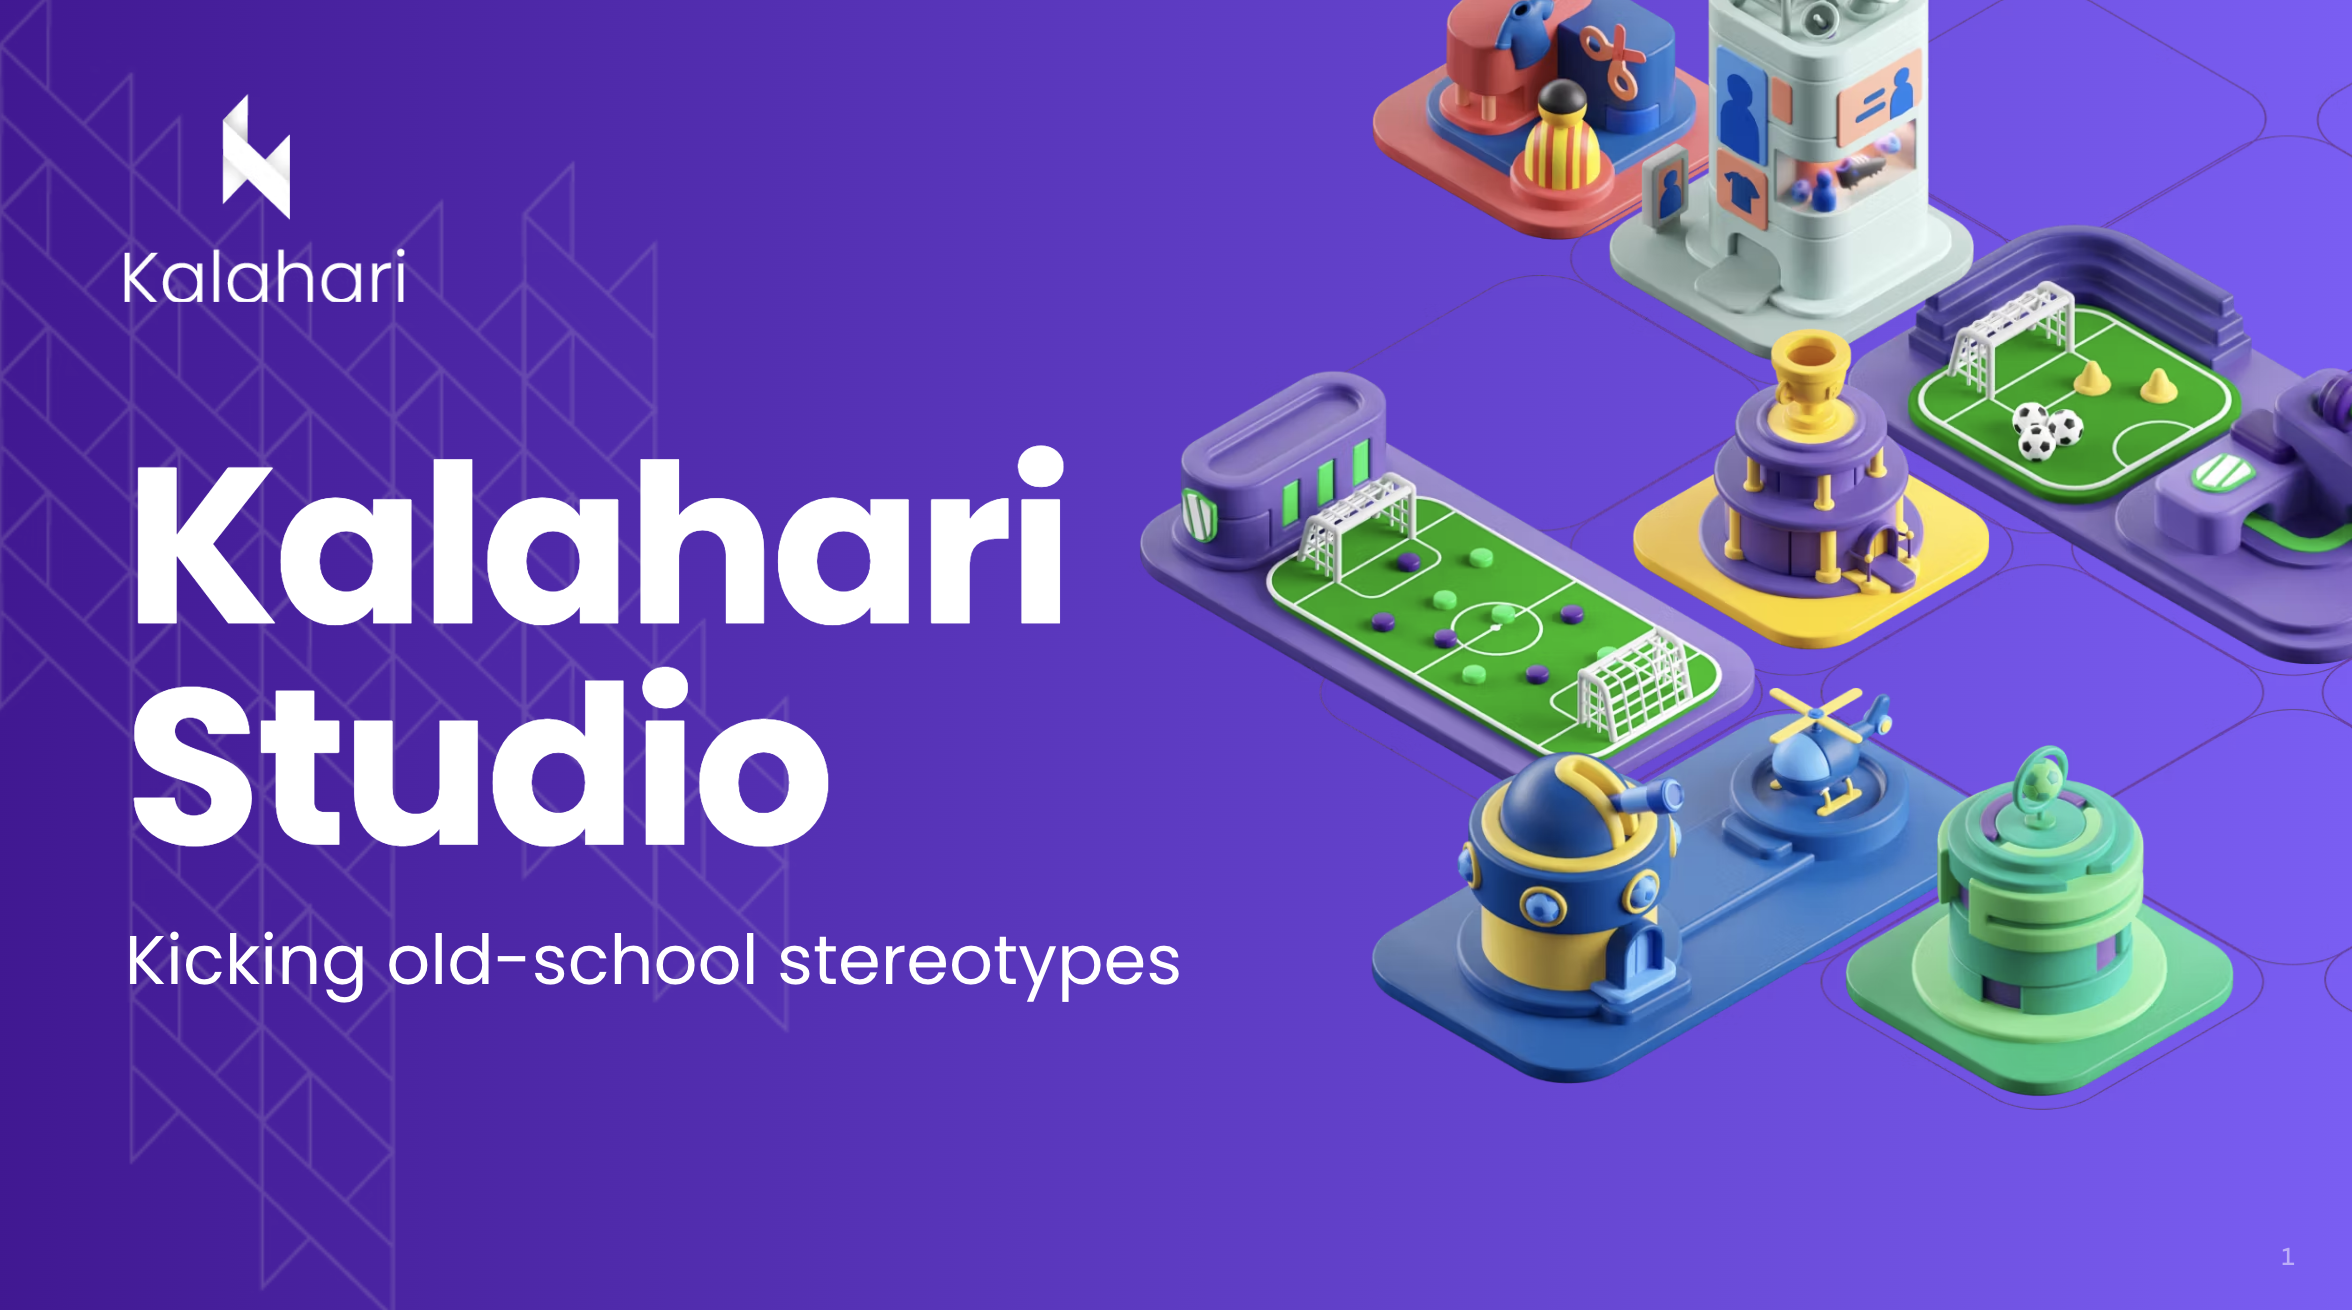
Kodo Web Agency
Project: Web copy for Club Kickoff, an online soccer game created by Kalahari Studio, focused on inclusive gameplay and pitched at Nordic Game 2024 in Malmö, Sweden.